
Federal tax relief for low income people
Discussion Paper Prepared for the National Anti-Poverty Organization
by Andrew Mitchell and Richard Shillington
November 2004
The federal surplus and tax cuts
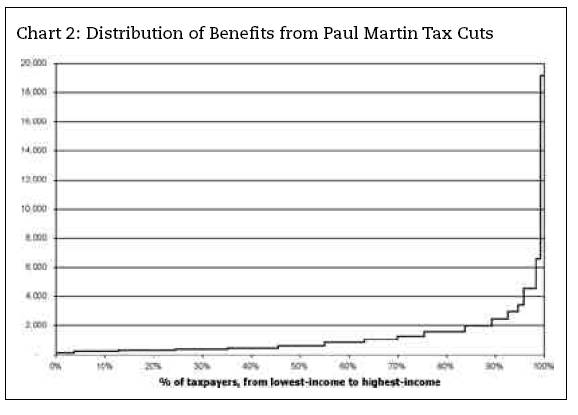
The federal finance minister has announced a surplus of approximately $9 billion, and has speculated that some portion of that might be devoted to tax cuts. However, the chart below demonstrates that past income tax reductions have provided disproportionate benefits to those with middle and upper incomes.
Our rough estimate is half the benefits over the last decade have gone to those 10% of families with incomes over $100,000.
Hell and High
Water; An assessment of Paul Martin’s record and implications
for the future; Edited by Todd Scarth; Chapter 3 - Taxation: The Martin
Record by Hugh Mackenzie
There are several good arguments for directing tax cuts to low-income people. Low-income people have suffered serious erosion in real income. Tax cuts directed at low-income persons will increase their spending immediately (to ‘Pay the Rent’, ‘Feed the Kids’ and purchase necessities). This fuels the local and Canadian economy directly and immediately – none of the money would be used for investment, foreign vacations, or luxury vehicles.
What federal taxes do low-income people pay? (1)
Everyone is a taxpayer. Even a child buying a chocolate bar pays a consumption tax. People employed at very low wages also pay consumption taxes but also make social insurance contributions to EI and CPP/QPP.
Table 1 shows that low-income people will pay over $4 billion dollars in federal taxes in 2004. Of this, approximately 70 percent, comes from federal commodity taxes. The remainder comes from income taxes (12%), CPP/QPP contributions (12%) and EI contributions (5%). This amounts to approximately $1,400 per low-income family, of which about $1,000 comes from commodity taxes, $172 comes from federal income taxes, $169 from CPP/QPP premiums and $66 comes from EI premiums. Recall, these are federal taxes only. Low-income families still have to pay provincial income, sales and property taxes.
Table 1: Federal taxes paid by low-income and non-low-income people |
||||||
Canada 2004 |
||||||
Economic family income |
Population |
Total Federal taxes |
Federal income taxes |
CPP/QPP contributions |
EI contributions |
Federal commodity taxes |
(000’s) |
($millions estimated) |
|||||
Poor * |
4,900 |
$ 4,200 |
$ 500 |
$ 500 |
$ 200 |
$ 3,000 |
Near-Poor ** |
2,300 |
$ 3,500 |
$ 1,000 |
$ 600 |
$ 200 |
$ 2,000 |
Not poor nor near poor*** |
24,200 |
$ 145,000 |
$ 88,000 |
$ 19,000 |
$ 7,700 |
$ 30,000 |
All |
31,400 |
$ 152,000 |
$ 89,000 |
$ 20,000 |
$ 8,200 |
$ 35,000 |
*pre-tax LICO Statistic Canada’s Low-Income Cut-Off ** Above pre-tax LICO, <=125% of LICO *** Above 125% of pre-tax LICO |
||||||
It is also important to consider taxation from a life-cycle perspective. Most low-income people do not remain low-income for their entire lives. As their income status changes over their lives so too will their tax contributions. So, from a life-cycle perspective, as well as an ability-to-pay perspective it is appropriate for low-income people to pay very low, or no, taxes.
An important way of looking at personal taxes is to examine vertical equity, that is, what fraction of a person’s income is paid in taxes, as income rises. Figure 1 shows that federal taxes, as a percentage of income, rise gradually until the $40,000 - $50,000 range (2) at which point effective tax rates level off. The exception is at the low end of the range where effective federal tax rates are about 18% at the lowest income levels, due to commodity taxes, and some income taxes and social security contributions.(3) When you include provincial taxes, the poorest people are paying 35% of their income in taxes, tax rates that are comparable to those at the upper end because of consumption taxes. This includes just federal and provincial taxes and not CPP or EI contributions.
The most detailed and exhaustive research has demonstrated that o Once local property and corporate taxes are included , the overall tax system in Canada is not progressive. It is virtually proportional – all people pay similar percentages of income in tax, regardless of income.(4)
Options for tax reductions directed to low-income people
Many proposals for tax reductions are promoted, but not all have the same effects on everyone. To illustrate we compare four options for reducing taxes and the efficiency of each – that is, how much of the net benefit would end up in the hands of low-income families. The five options are to: reduce the GST rate from 7% to 6%; restore the value of GST credit for erosion in real value that took place between 1992 and 1999; increase the basic personal exemption from $8,000 to $12,000; and to reduce all tax rates by 1%. Table 2 shows the estimated impacts.
Since most of the federal taxes paid by low-income people are commodity taxes it makes sense to look at ways of reducing these taxes. The easiest route would be to simply cut the rate at which the GST is levied, currently 7%. This would cost approximately $5 billion in lost federal revenue, of which only about 9% would go to low-income families who, on average, would end up with $143 more disposable income.
Table 2: Impact of tax measures on low-income families |
|||
Canada, 2004 (estimated) |
|||
Tax measure |
Total Cost ($millions) 1 |
Share of benefit for low-income families 2 |
Average benefit for low-income families |
Reduce GST rate by 1% |
$ 4,996.5 |
8.5% |
$ 143 |
Index GST credit to previous purchasing power |
$ 601.1 |
19.0% |
$ 40 |
Increase personal credit to $12,000 |
$ 8,973.8 |
3.5% |
$ 111 |
Reduce all income tax rates by 1% point. |
$ 1,230.4 |
7.7% |
$ 33 |
Reduce all income taxes by 10%. |
$ 8,93500 |
0.5 % |
$ 17 |
1 Total cost is the change to the net federal balance. |
|||
2 Benefits are defined as the change in disposable income. |
|||
The GST credit was introduced with the GST to reduce its inherent regressive impact and is targeted to lower income families. But the value of the credit was fixed at the same nominal value between 1992 and 1999. A simple alternative is to increase the GST credit amounts and associated thresholds by the amount lost due to this erosion. Table 2 shows that this would cost the federal treasury about $600 million annually. A higher proportion of the net benefits (19%) would flow to low-income families. However the average benefit to low-income families is only about $40.
An increase in the basic personal exemption is often raised as a way to “remove low income people from the tax roles”. Indeed, this has the effect of raising the income threshold at which a person begins to pay federal income taxes. But because everyone can claim the personal exemption this benefits everyone who pays taxes, regardless of income. In fact, Table 2 shows that of raising the basic personal exemption from $8,000 to $12,000 would cost nearly $9 billion and deliver only 3.5% of the benefits to low-income families.
The reason that increasing the personal credit yields fewer benefits to lower-income families than cutting the GST rate is that many lower-income families already pay little or no income taxes ( many seniors as well as many of those on welfare ).
If instead the tax rates for each bracket were reduced by 1% the overall cost would be $1.2 billion of which nearly 8% would go to low-income families. On average low-income families would receive about $33 in increased disposable income.
Conclusion
Consumption taxes make up the largest part of the taxes paid by low-income people, with income taxes and social insurance contributions a distant second and third place. Changes to the income tax system will have limited benefits for low-income families. It is logical to look for changes in the consumption tax regime if the goal is to deliver benefits to low-income Canadians.
However, it would require much larger increases in the GST credit to deliver substantial benefits to low-income Canadians, and to offset the heavy consumption taxes they pay. Also, even though the GST credit was the option that delivered the highest proportion of benefits to low-income people it is important to recognise that a large increase in the credit would raise the income level at which families receive some benefit.
1. This analysis is based on Statistics Canada's Social Policy Simulation Database and Model. The assumptions and calculations underlying the simulation results were prepared by Andrew Mitchell and Richard Shillington and the responsibility for the use and interpretation of these data is entirely that of the authors.
2. This includes approximately 80% of individuals with incomes.
3. The situation of this group should not be dismissed as an anomaly as they represent about 20% of all individuals with incomes.
4. Frank Bermaeten, W. Irwin Gillespie and Arndt Vermaeten, “The incidence of tax in Canada” (1994), Canadian Tax Journal, vol. 42, no. 2, 348-416.